Trace searches and ingestion
VectrixDB can send a span for every search, ingestion and evaluation run to the tracing tool you already use: Jaeger, Grafana Tempo, Honeycomb, Datadog, Azure Monitor, or any OpenTelemetry collector. It is off until you turn it on, and when it is off it costs one boolean check per call.
Turn it on
pip install "vectrixdb[tracing]"
export OTEL_EXPORTER_OTLP_ENDPOINT=http://localhost:4318
vectrixdb serve
For vectrixdb serve, vectrixdb extract-serve and vectrixdb mcp, setting OTEL_EXPORTER_OTLP_ENDPOINT is enough: the process is VectrixDB's own, so it sets up the exporter. VECTRIXDB_TRACING=1 turns tracing on too, with the exporter's default address unless the endpoint is set, and in a plain script it also sets up the exporter. VECTRIXDB_TRACING=0 keeps it off even with an endpoint set. OTEL_SERVICE_NAME names the service, vectrixdb unless set. The other standard OTEL_EXPORTER_OTLP_* variables, headers for a hosted backend among them, are read by the exporter as usual.
In an app that sets up OpenTelemetry itself, the spans join the app's own traces, under whatever request span is current. With OTEL_EXPORTER_OTLP_ENDPOINT set, which such an app usually has, nothing more is needed, whether the app sets up OpenTelemetry before importing VectrixDB or after: VectrixDB never sets up a provider of its own there, so it never stands in the way of the app's. Without the variable, turn it on in code:
import vectrixdb

vectrixdb.tracing.enable()      # the app's global tracer provider
# or vectrixdb.tracing.enable(my_provider)
print(vectrixdb.tracing.describe())

vectrixdb.tracing.disable()     # off again: one boolean check per call
enable() returns False, and nothing changes, when OpenTelemetry is not installed.
See it in Jaeger
The container images come with a Compose file that starts Jaeger beside the server and sends the server's spans to it:
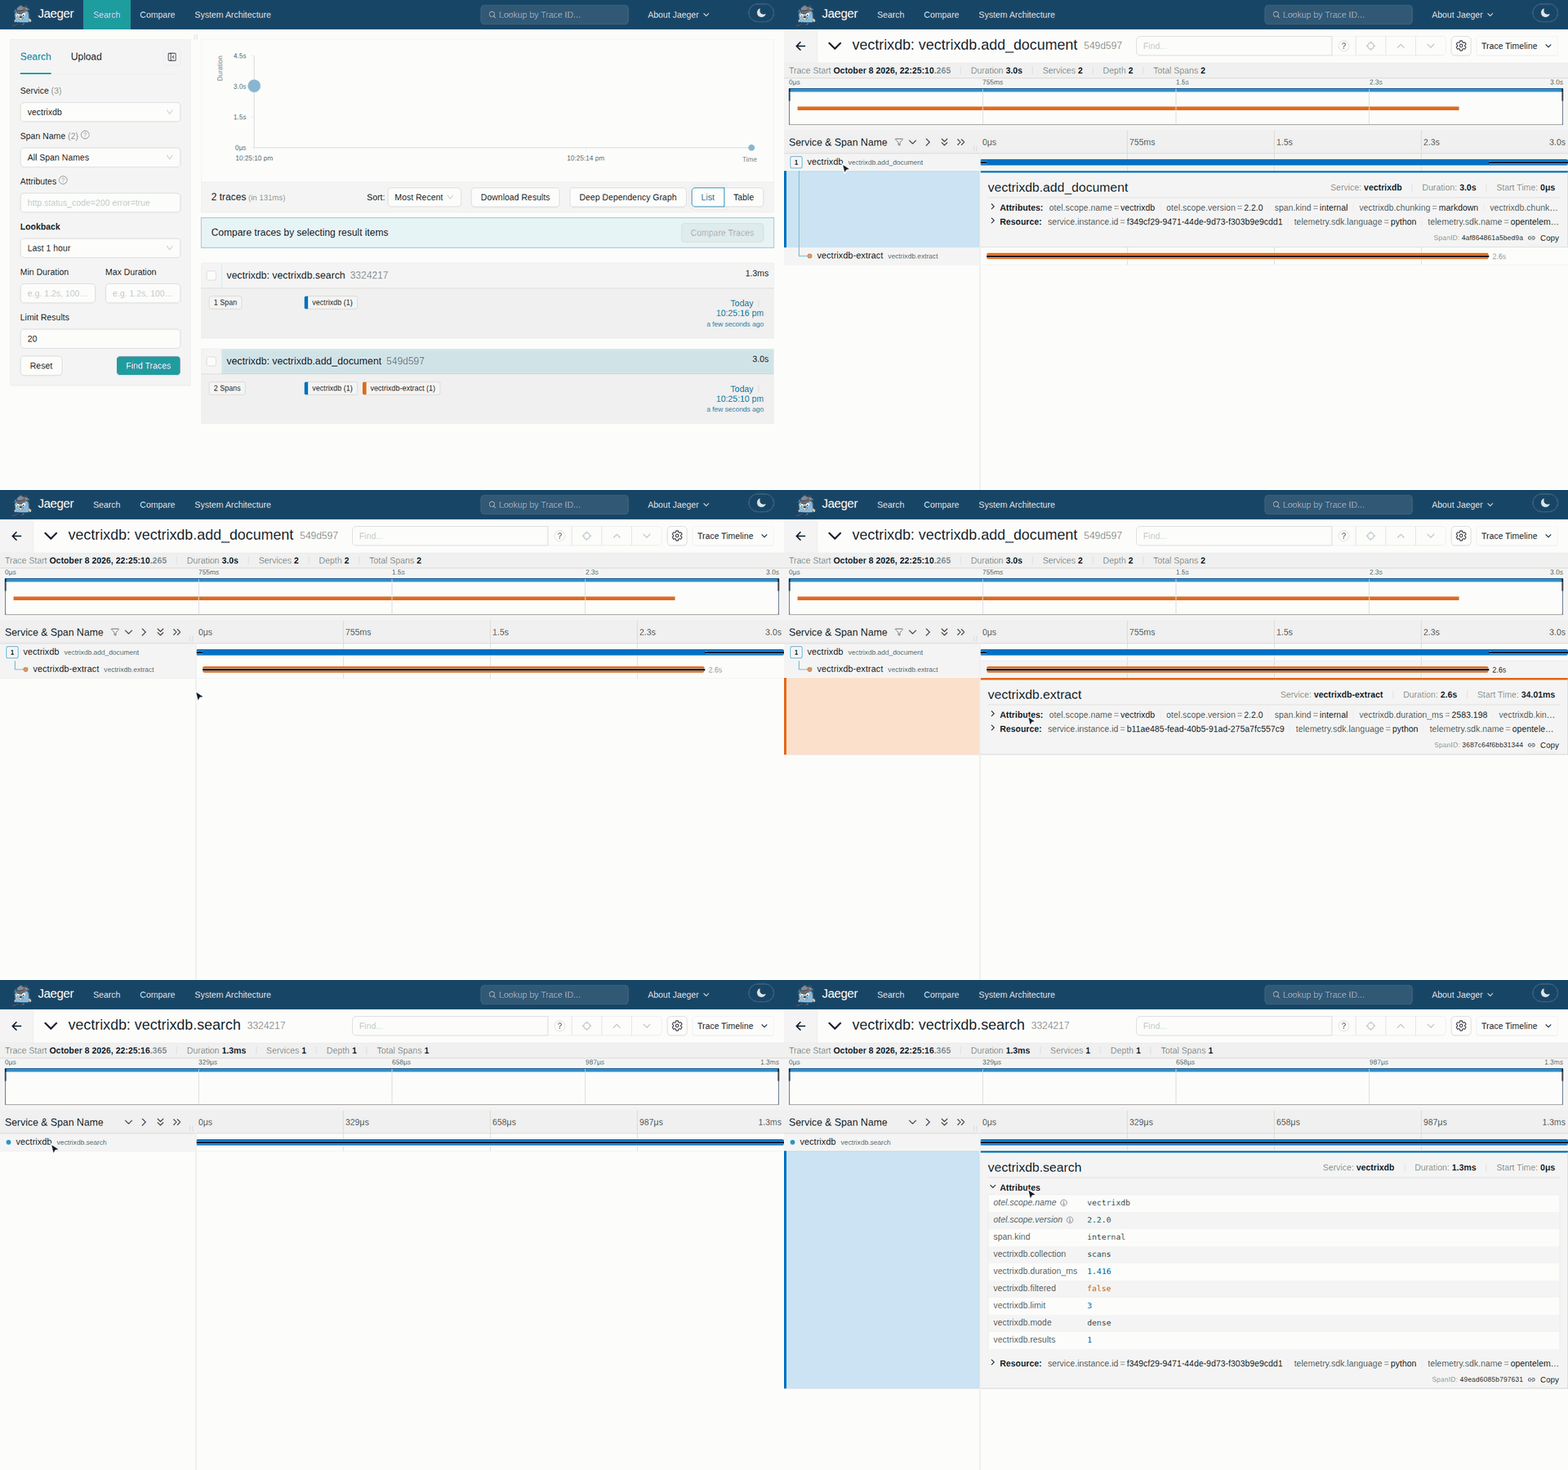
Run a search, open Jaeger at http://localhost:16686 and pick the vectrixdb service. A scan uploaded to the server is one trace across both containers, its vectrixdb.extract span from the vectrixdb-extract service. The key file the server needs first, and the rest of the setup, are in Run it in containers.
What you get
| Span | When | Attributes |
|---|---|---|
vectrixdb.search |
Vectrix.search, and every search the REST server runs |
collection, mode, limit, rerank, filtered, results, top_relevance, top_relevance_kind, degraded, truncated |
vectrixdb.add_document |
each document ingested: by add_document, an upload to the REST server, or a source read again |
collection, kind, chunking, chunks |
vectrixdb.extract |
each file the extraction service reads | kind |
vectrixdb.rechunk |
rechunk() and rechunk_preview() |
collection, preview, chunks, documents |
vectrixdb.write_golden |
drafting golden questions | collection, limit, questions |
vectrixdb.evaluate |
an evaluation run | questions, setups, collections |
vectrixdb.mcp.tool |
each tool an assistant calls on the server's MCP endpoint, and each resource it reads; the search the tool makes sits inside it | tool, collection, refused |
Every attribute is named vectrixdb.<name>, and every span carries vectrixdb.duration_ms. A search that calls itself again, a fallback or a second home, is one span. A rechunk holds a span for each document it adds again, and an evaluation holds a span for each search it runs on a VectrixDB collection, so a slow run shows which step was slow.
Across services
A request to the REST server or the extraction service with a traceparent header puts its spans in the caller's trace, so a search your app makes sits under your app's own span. A file the server sends to the extraction service, or that add_document sends with an HttpExtractor, is read in the same trace, so one trace shows the upload, the reading and the indexing. Neither server makes a span for each request: one would carry the request's path, a document's id in it, and its query string.
What a span never carries
No query text, no document text, no file names, no metadata values, no keys. A span says that a search ran, how it ran and how well it scored, the way the audit records carry a query's fingerprint and never its words. An exception is recorded by its type alone, because its message can quote a query or a path. Only the names listed above can be set on a span, so a later change to the code cannot add text to one by accident.
Where to look
The dashboard's settings, under your account at the top right, say whether tracing is on and the host the spans go to. The spans themselves are in your tracing tool, which is built for searching and graphing many of them. For searches a day, search time and refusals, the dashboard's Overview and audit trail are already there.