Use the dashboard
vectrixdb serve also serves a dashboard at /dashboard/: the collections,
their health and text, search, the evaluation runs, and with sign-in on, who
may do what. It is plain JavaScript served by the server itself, with no build
step, and it works at phone, tablet and desktop widths.
Then open http://127.0.0.1:7337/dashboard/. What each page shows depends on
the role of whoever is signed in; see Sign people in.
The pictures on this page are of a sample server. python
scripts/dashboard_shots.py fills one in, with made-up collections and two weeks
of made-up activity, and takes every picture again, so they show the dashboard
as it is after any change.
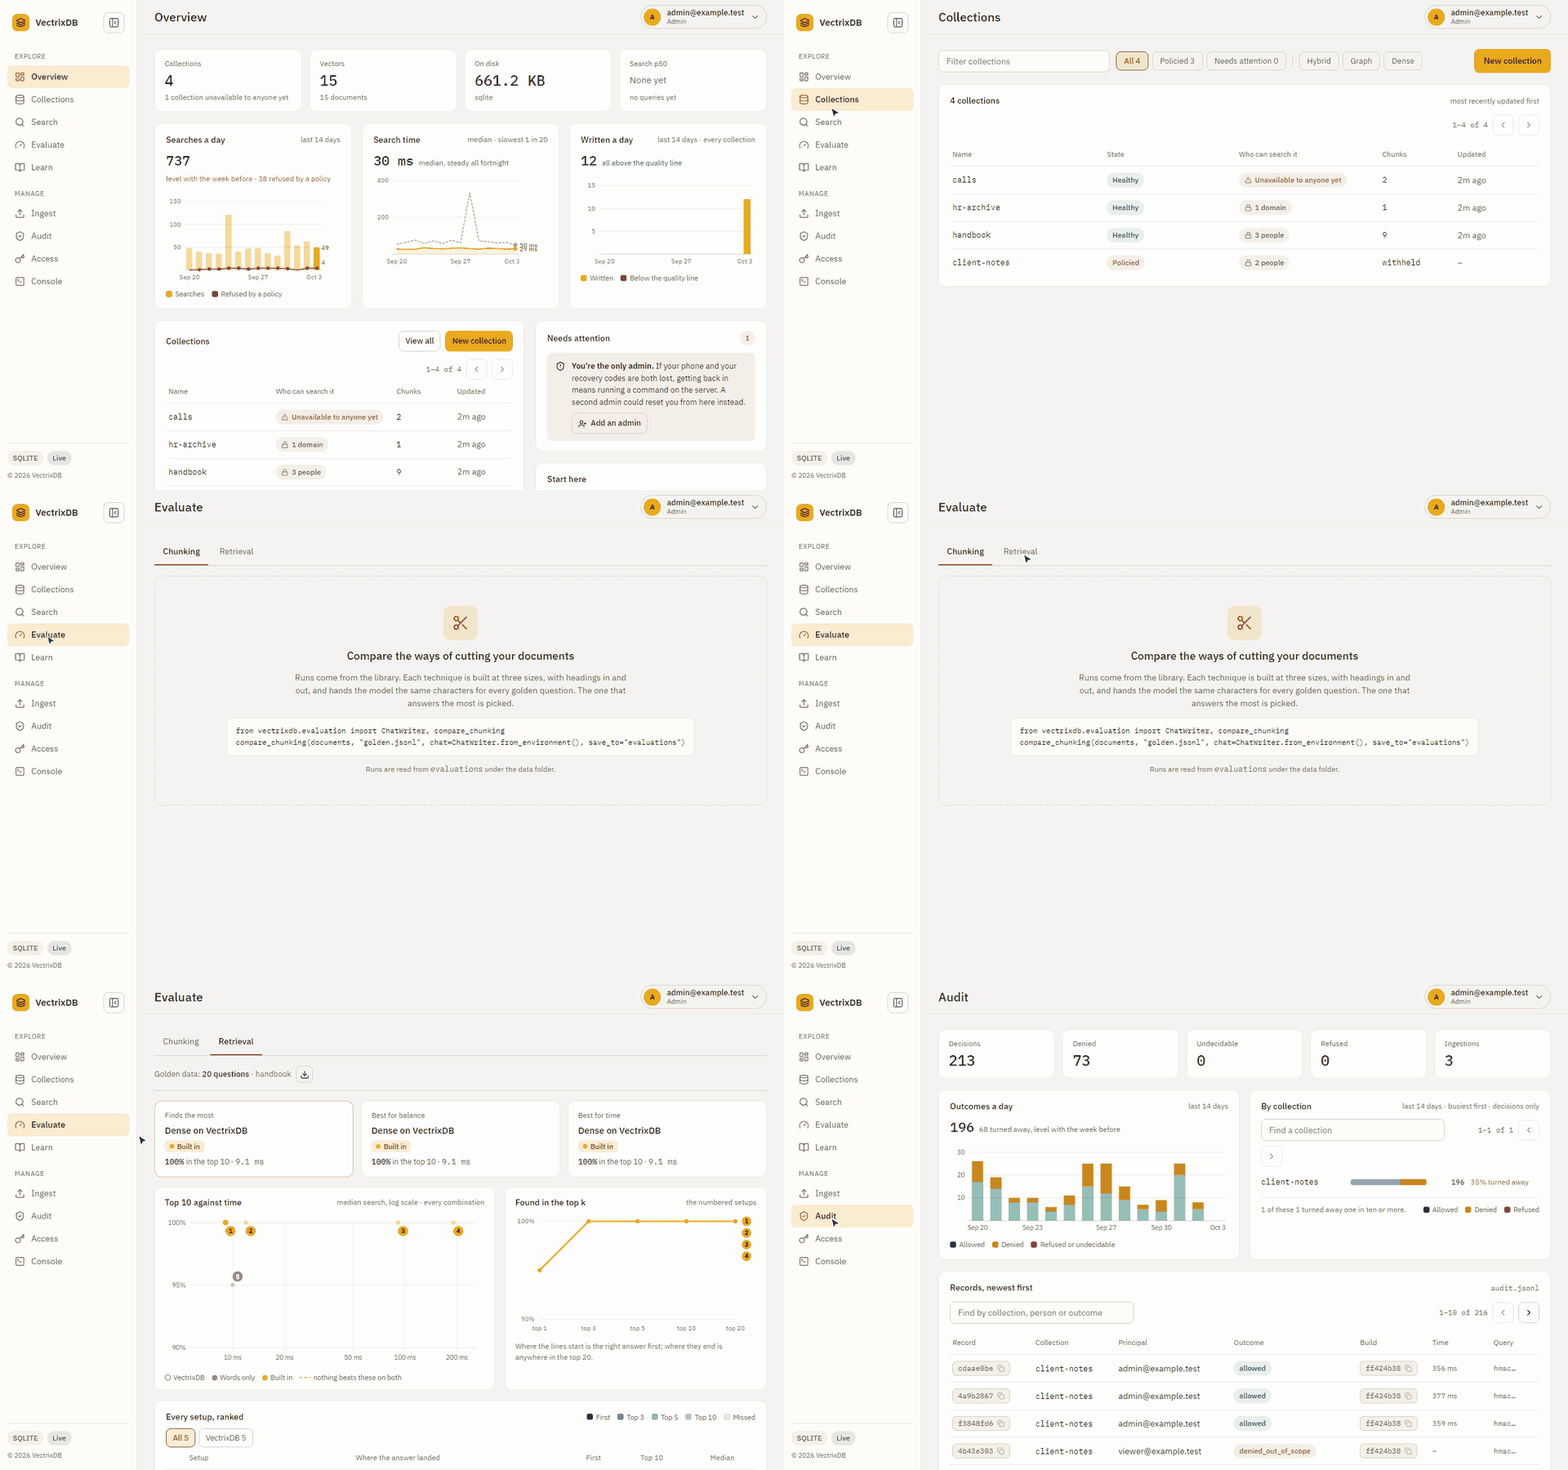
| Page | Who sees it |
|---|---|
| Overview, Collections, Learn | everybody signed in, and guests |
| Search | operators and admins |
| Evaluate | everybody signed in, and guests |
| Ingest, Console | operators and admins |
| Audit, Access | admins |
Overview
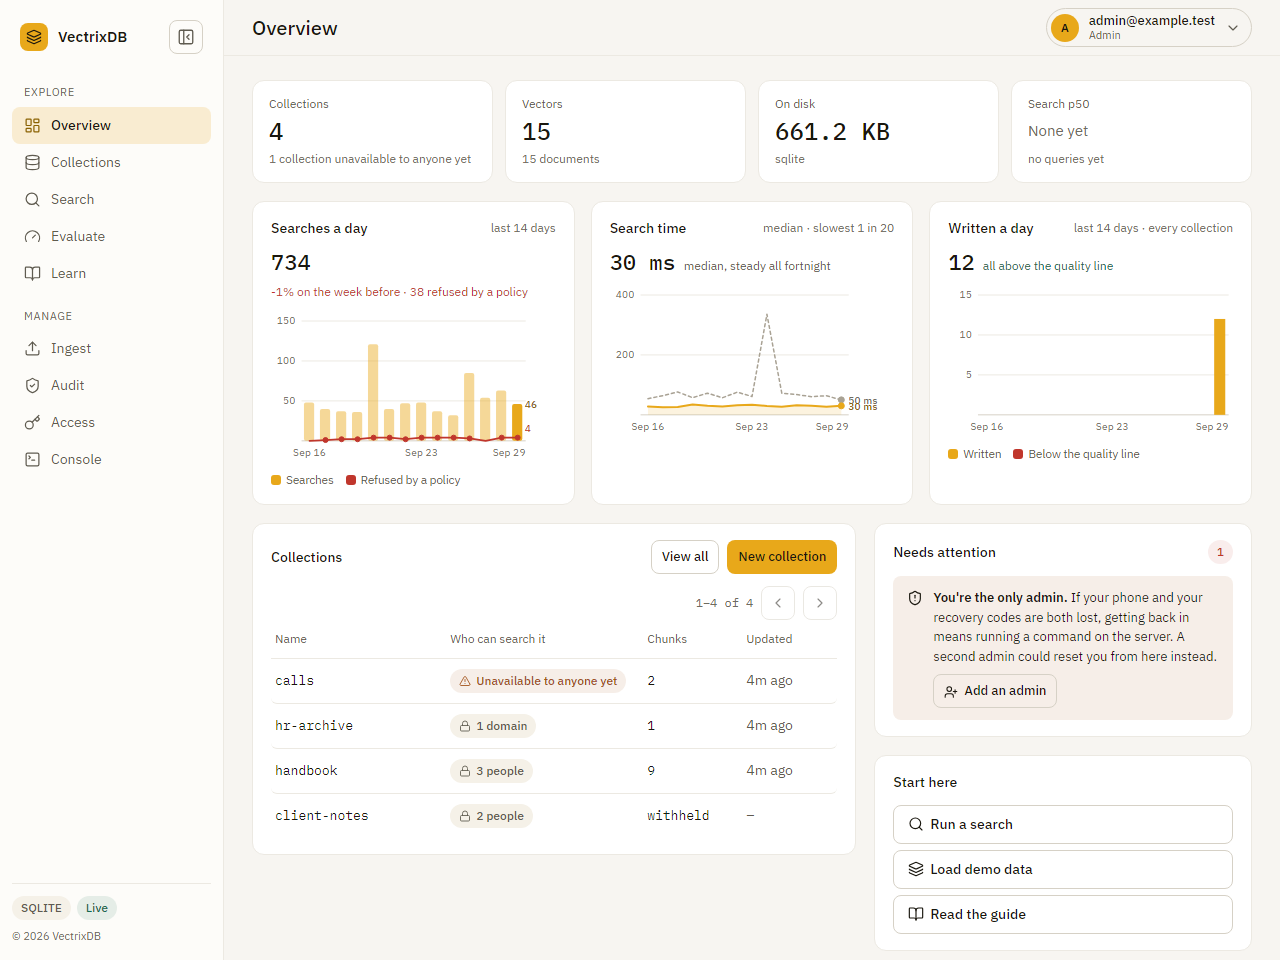
How much is stored, how fast searches are, the collections by when they last changed, and what needs a person: a collection due a rebuild, a model that is missing, the only admin with no second.
Between the tiles and the collections, three charts of the last fourteen days: searches a day, with the searches a collection's policy refused drawn over them as a red line for whoever may read the access log; search time, the median and the slowest one in twenty, which is where search getting slower over a week shows before anybody complains; and written a day, the chunks written across every collection, the part under the quality line in red, which is where a bad ingest shows, and a click on it opens Ingest. They are counts and nothing else: no names, no collections. A guest sees the same three, without the red line. Sign-ins against refusals moved to the Access page, where the people are. The row is left out, rather than drawn empty, when there is nothing to count from: no collections yet, or no log and nothing written. The collections below them turn ten a page, as every list on the dashboard does. Days are UTC. Search time is what the server measured: a search's line in the access log says how long the server took over it, and nothing about what was asked. The card appears once a search has been timed, so a log from before 2.2 shows two charts until somebody searches. The Search p50 tile is still this browser's own searches, which includes the network.
Collections
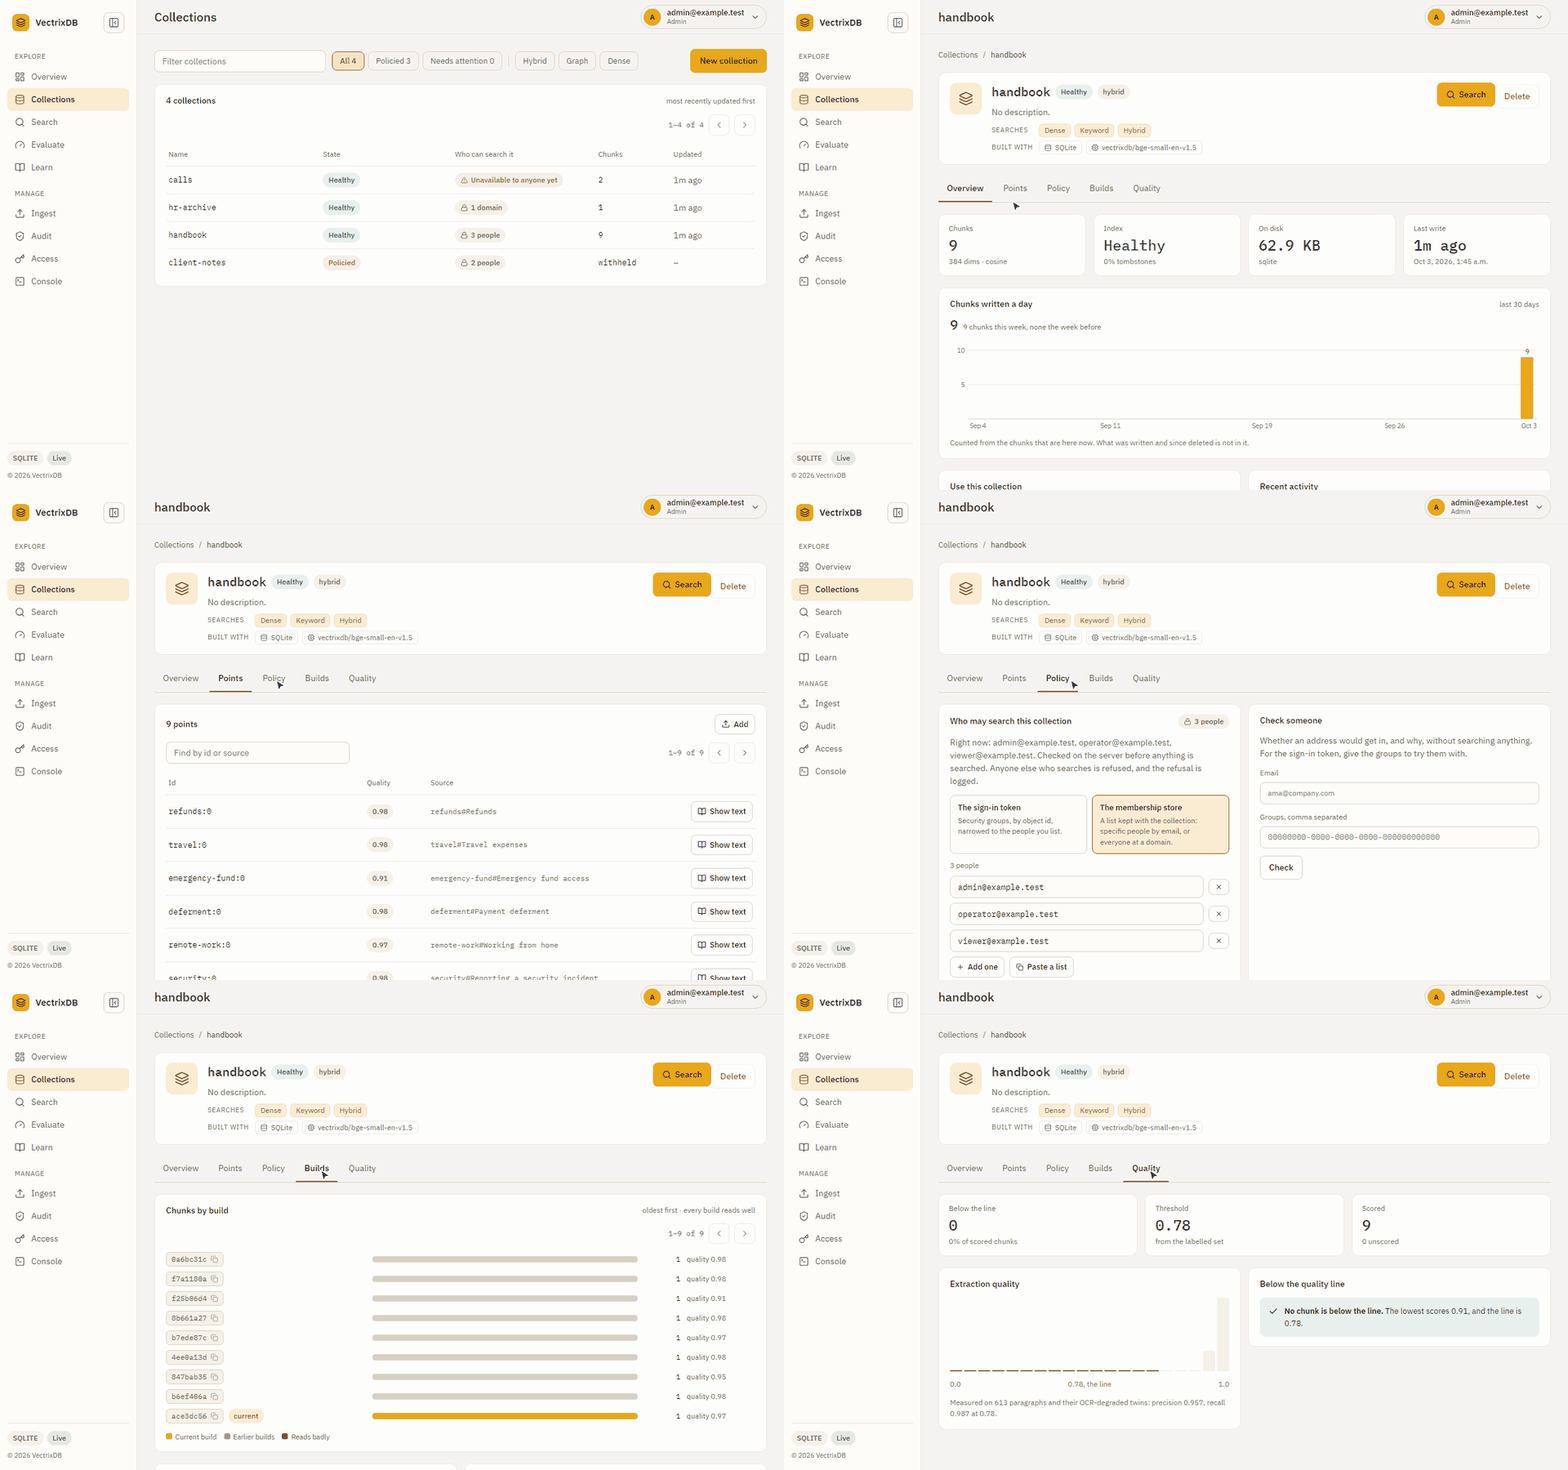
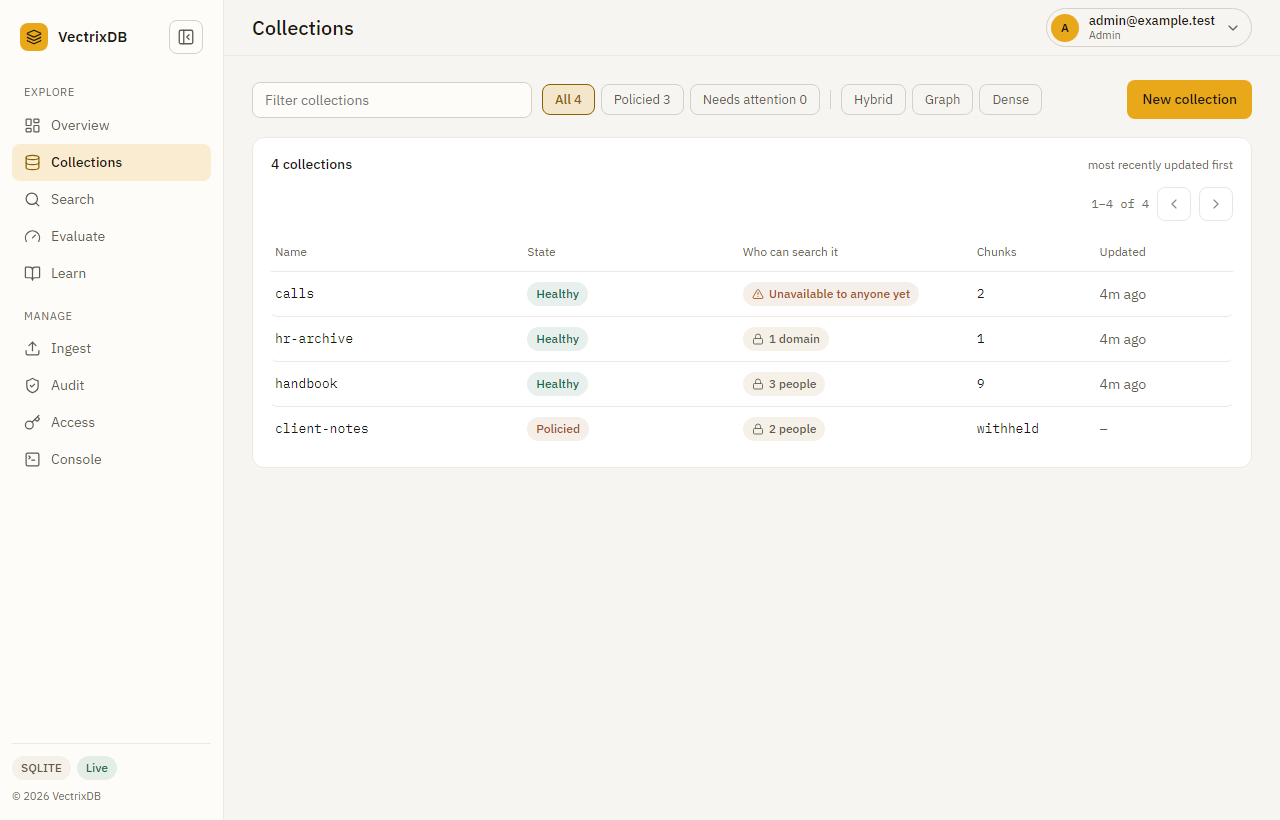
Every collection with its state, who may search it, its size and when it last changed, ten a page. A collection opens on its own page: how it can be searched, what it is built with (the store, the model that embedded it, what read its files), and five tabs: Overview, Points, Policy, Builds and Quality.
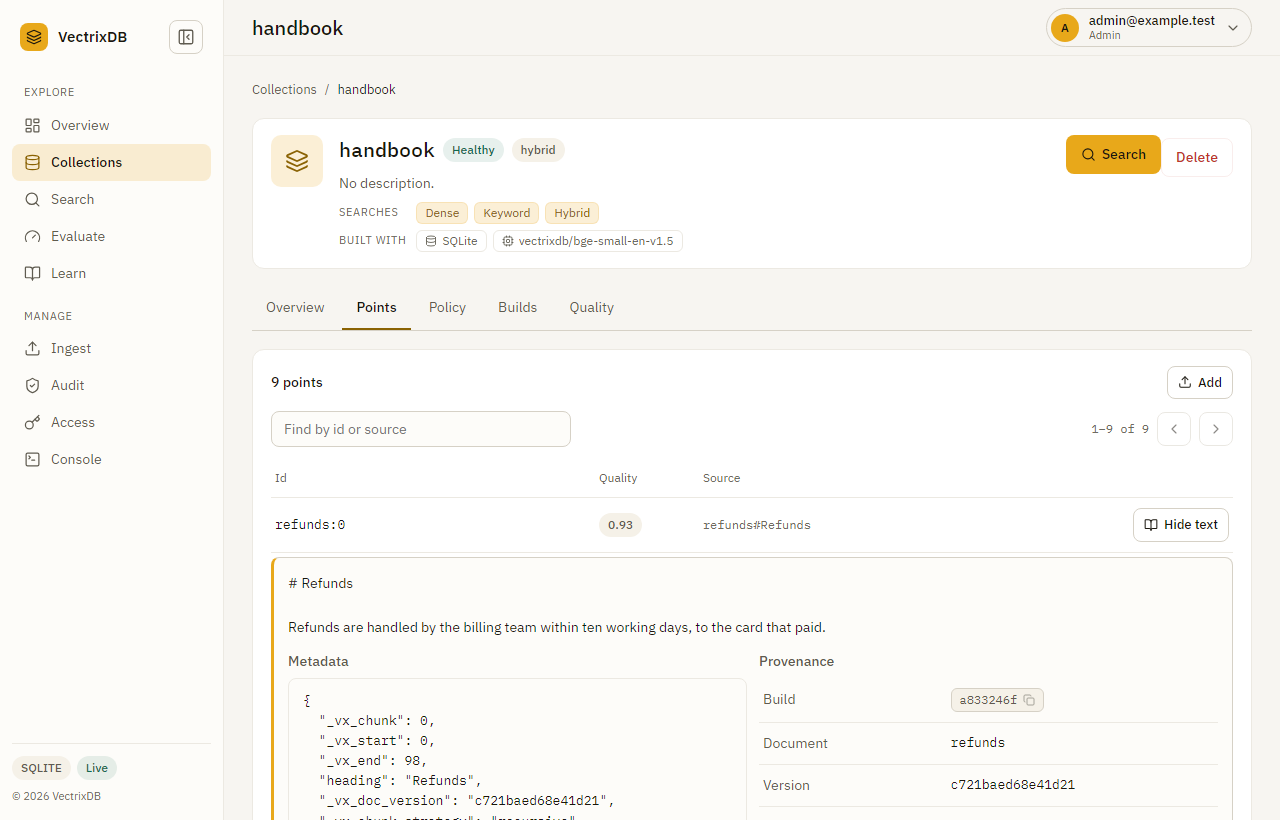
Points lists chunks by id, source and quality, never with their text. Show text opens one chunk, and the access log names it. Quality lists only the chunks under the quality line, with what is wrong with each in words. Builds lists every index build that still has chunks, newest first, with how each reads: its chunks' mean quality, marked when it is under the line. Above the list, once there are two builds, chunks by build, oldest first, with a build that reads badly in its own colour, which is where a bad ingest shows at a glance. Overview draws chunks written a day for the last thirty days under its tiles. Both are counted from what each chunk carries, the time it was first written, its build and its quality score, so neither needs a log or an audit trail, and both are what is here now: a chunk written and since deleted is not in them.
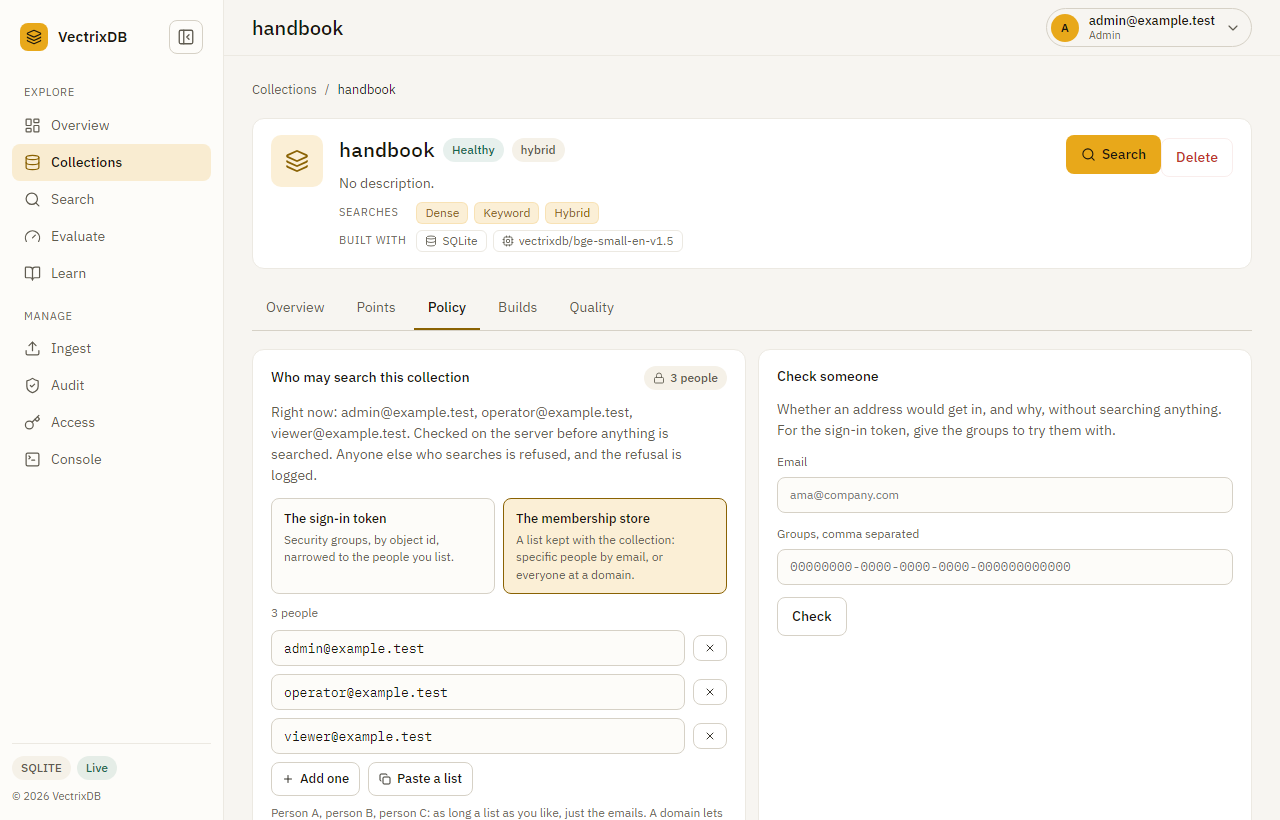
Policy is who may search the collection: people by work email, or everyone at a domain, kept with the collection; or security groups from the sign-in token, narrowed to a list of people. Check someone says whether an address would get in, and why, without searching anything. A collection with no policy is unavailable to anyone until one is set, and the list says so. Every save asks for a check from the last ten minutes.
Search
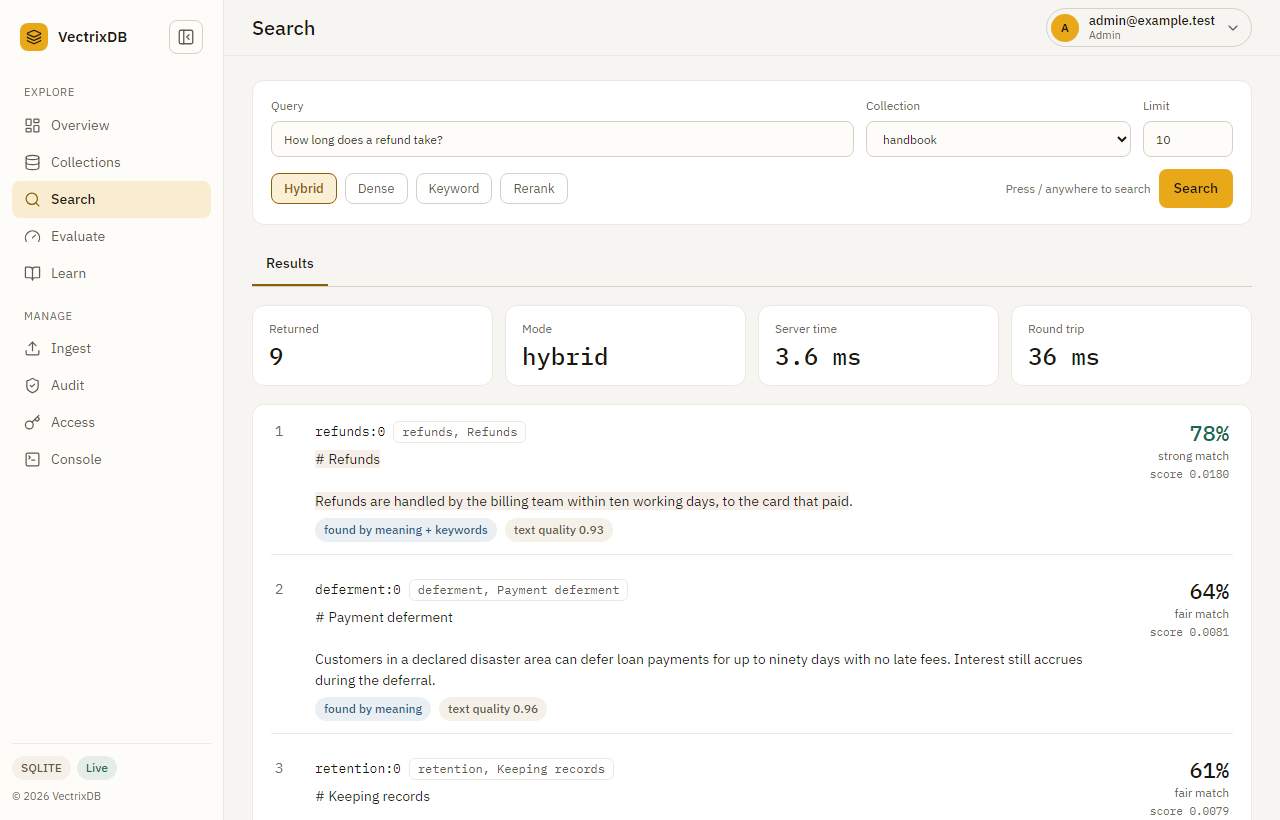
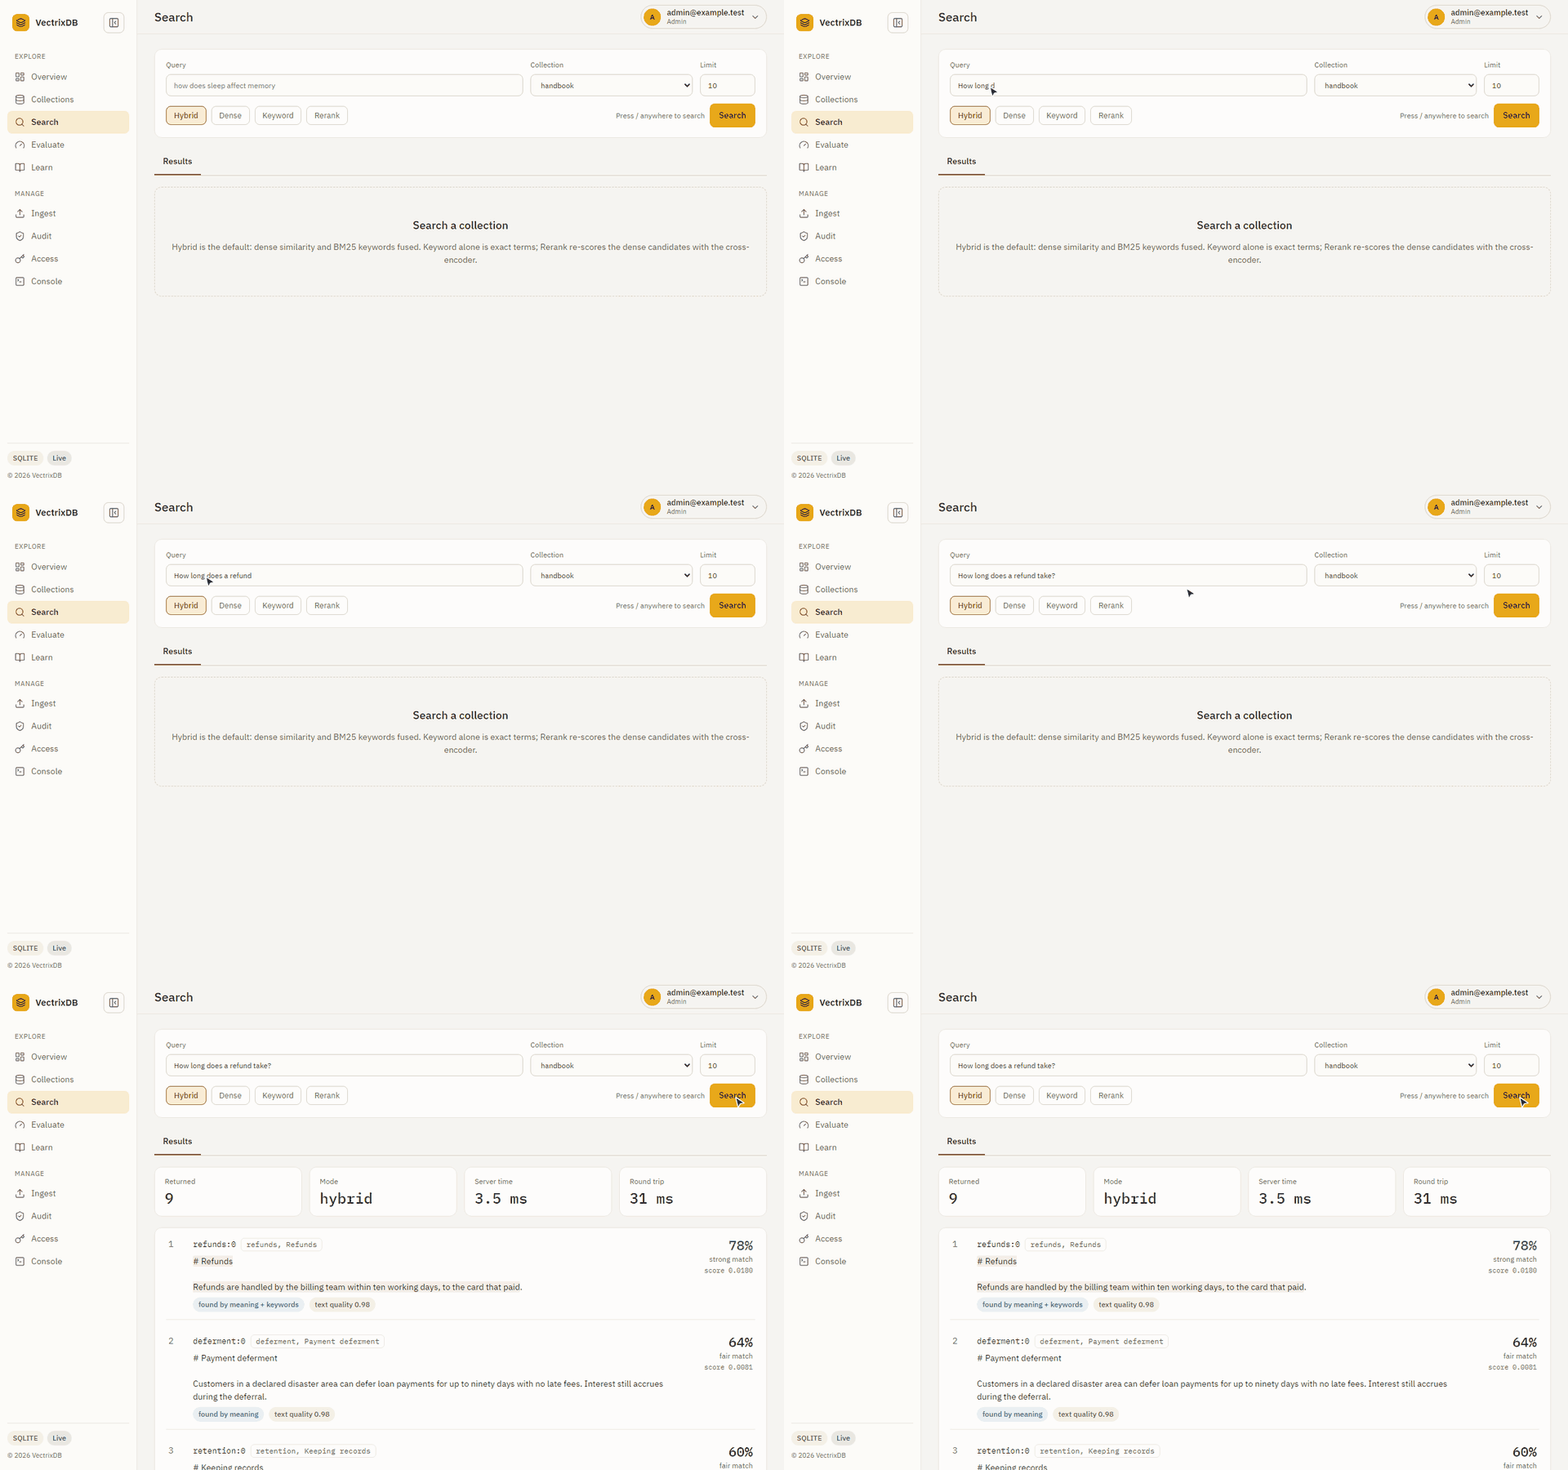
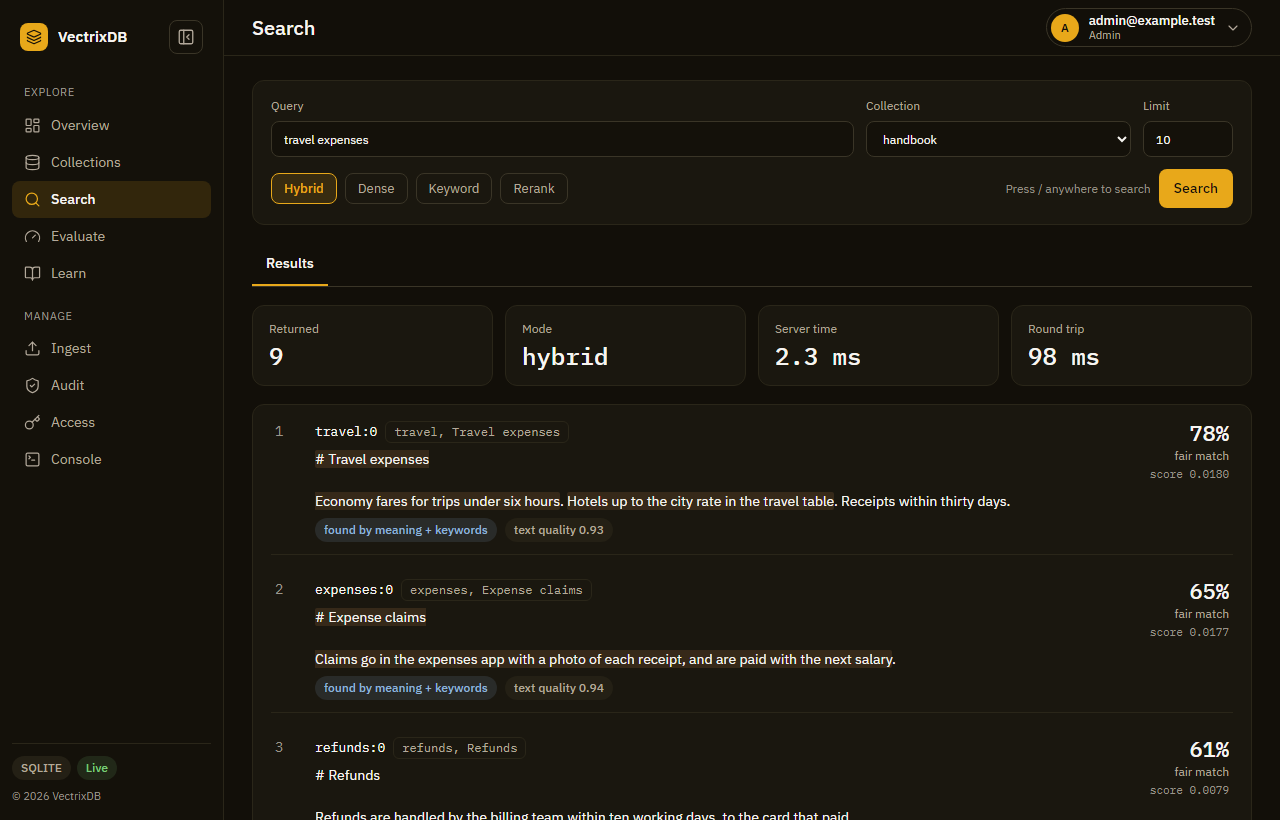
Dense, hybrid, keyword and reranked search, with the modes a collection cannot
do greyed out and saying why. Each result leads with its relevance, a
percentage and a word, and says whether meaning, keywords or both found it; the
score sits under it. Copy as Python gives the same search as a few lines of
Python. The Graph tab is there only when a collection on the server was made
for graph search, and draws that collection's knowledge graph; the graph
library is fetched the first time the tab is opened, so a server without
graphs never loads it. Press / anywhere to come here.
Evaluate
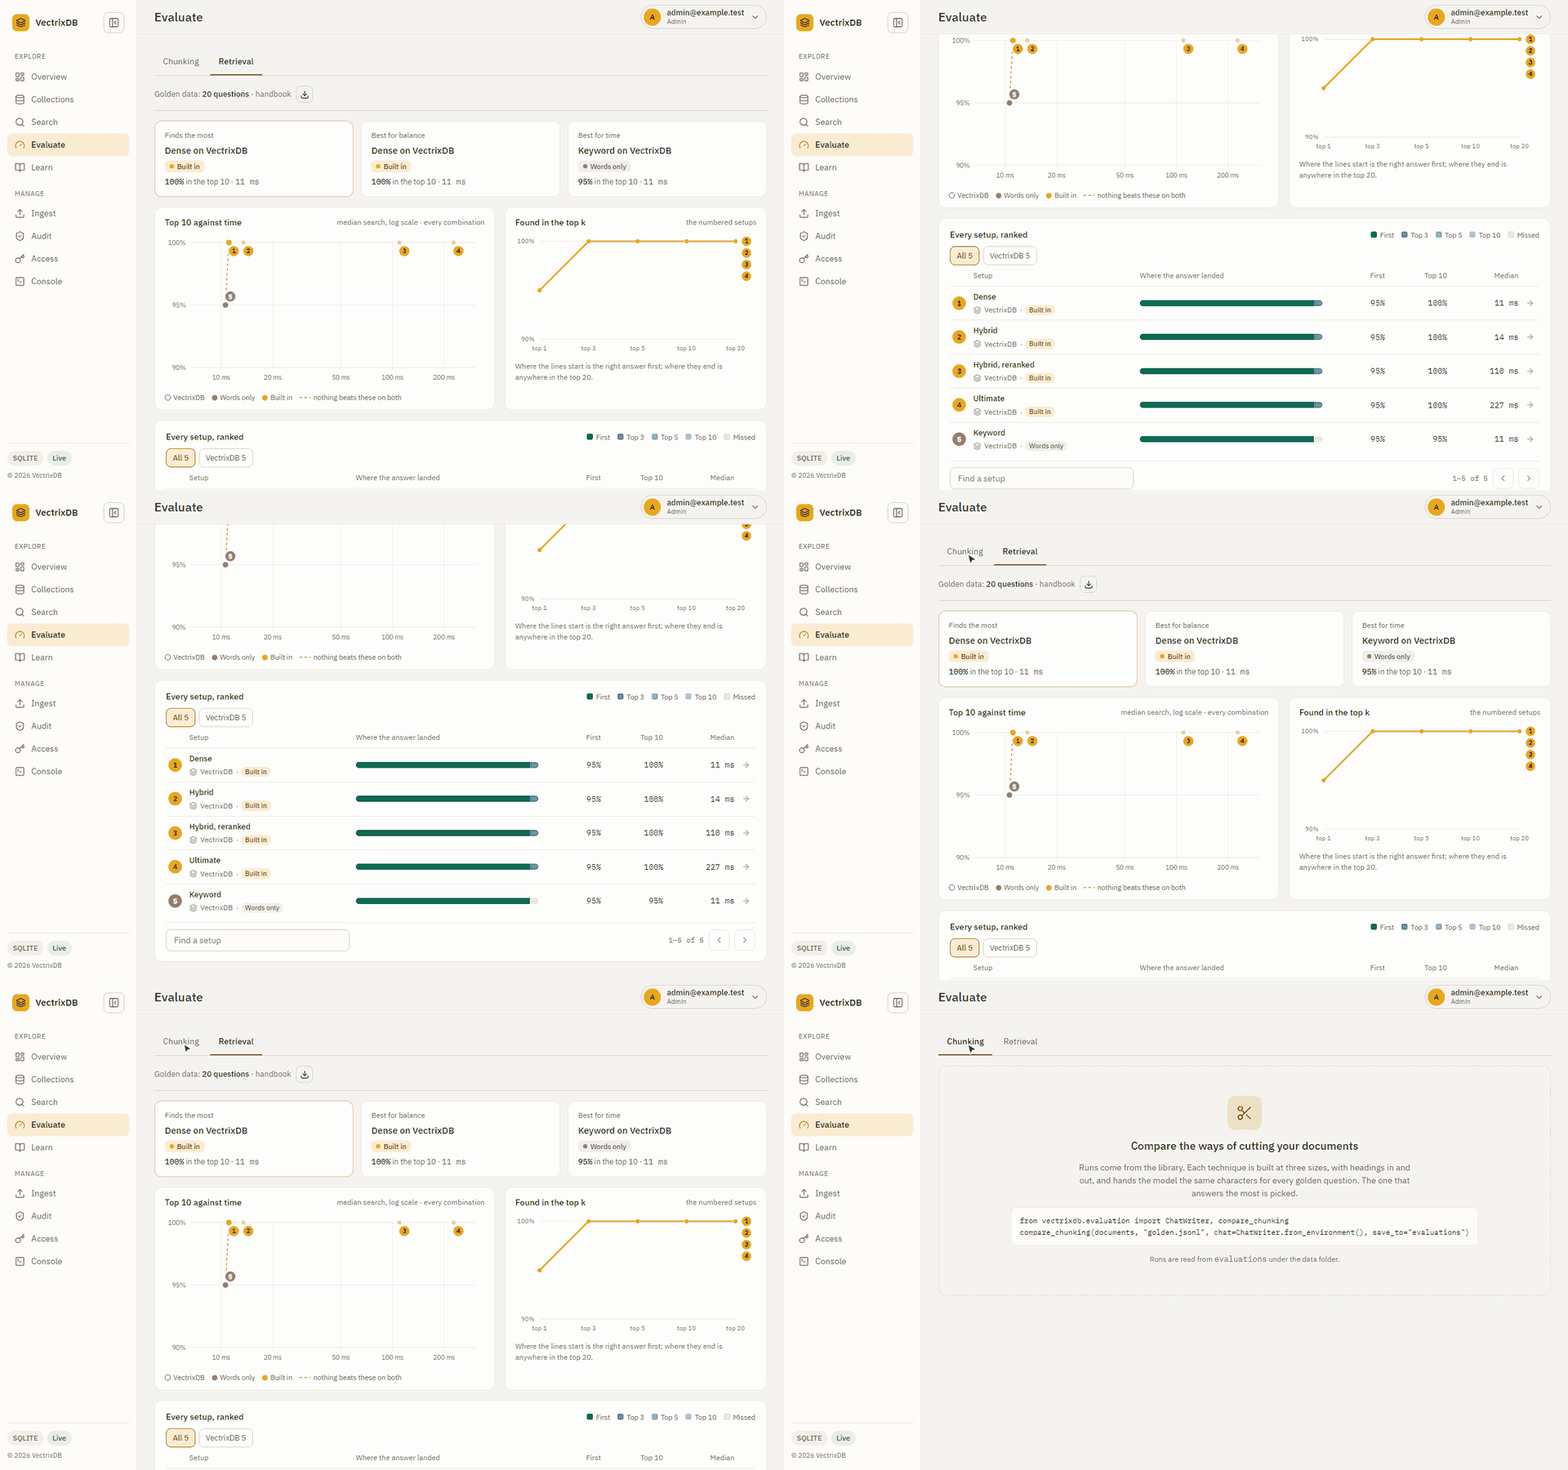
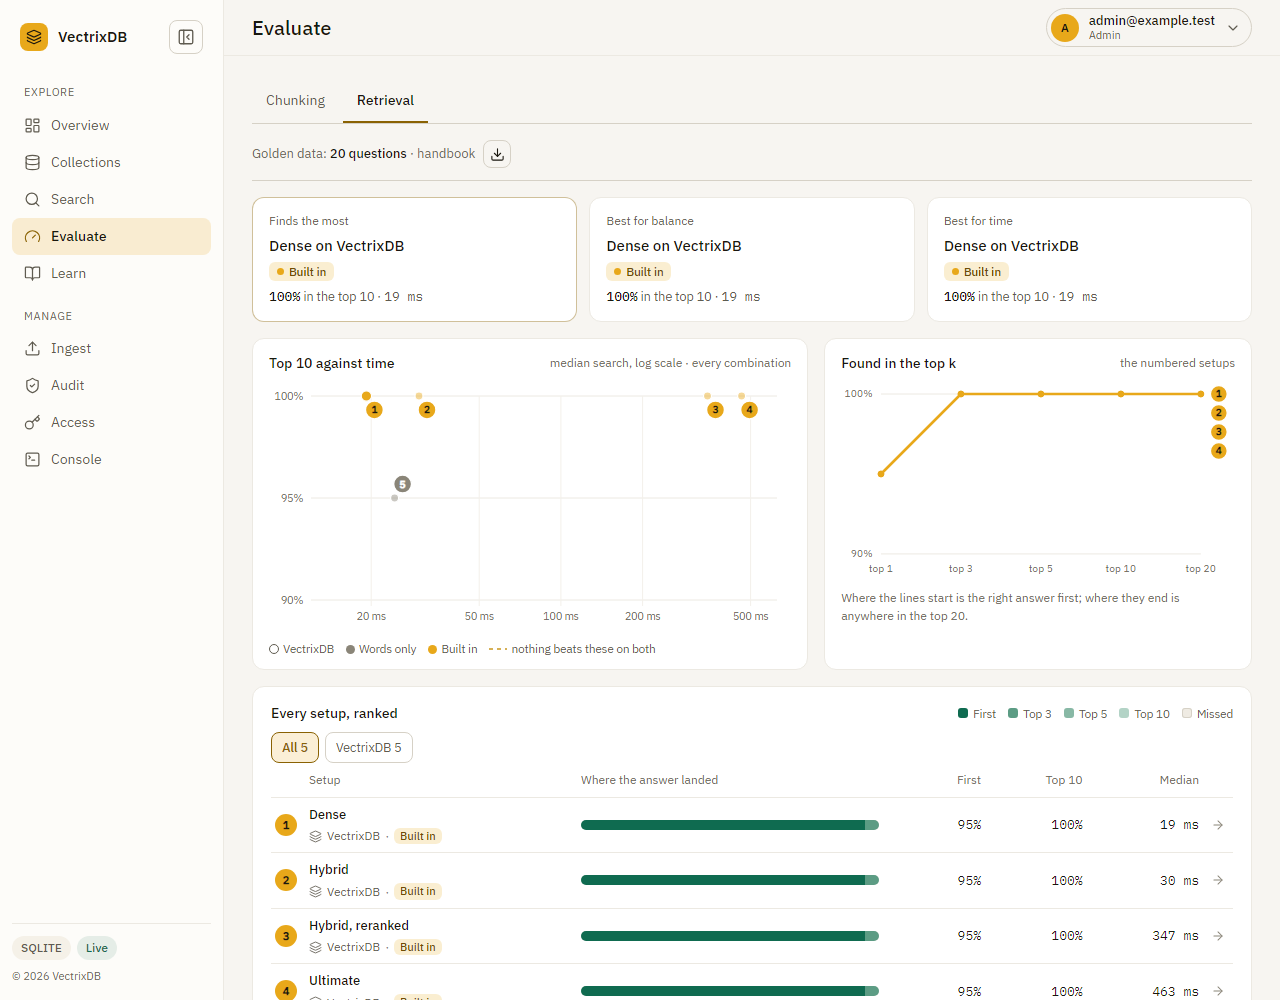
The run in the picture was measured on the sample: twenty questions over nine short documents, where every setup finds every answer, so the three picks all name the fastest. It shows how the page reads, not how well a setup searches; Evaluate every setup is how to measure your own.
Two tabs, Chunking first, and each opens on its newest run.
Chunking is the newest run of Compare the chunking techniques: the best technique, the next best against it with the questions only one of the two got right, and whether the gap between them could be luck, every technique ranked at its best settings, answered right by chunk size, and answered against found for every build. Each technique's bar says what happened to the questions: answered right, found and answered wrong, or not found. A technique opens its own page with its sizes with headings in and out, how it did against each of the others on the same questions, its runs, and what changing one setting did. A run made with no model to answer counts what was found instead, and says so.
Retrieval is the newest run of Evaluate every setup: the three picks, found in the top 10 against search time, found at each depth, and every setup ranked, seven to a page. Each setup's bar says where its answers landed in five bands: first, top 3, top 5, top 10 and missed. A run saved before the top 5 had a band of its own is drawn with the four it has. A setup opens its own page with how far down its answers were and its top 10 run by run.
On both, the menu at the end of the golden data line opens an older run, and
an admin can download the golden file a run read. An address from before the
tabs, #/evaluate/<setup>, opens that setup under Retrieval. Runs are made by
the library, the command line or a function, never here.
Ingest
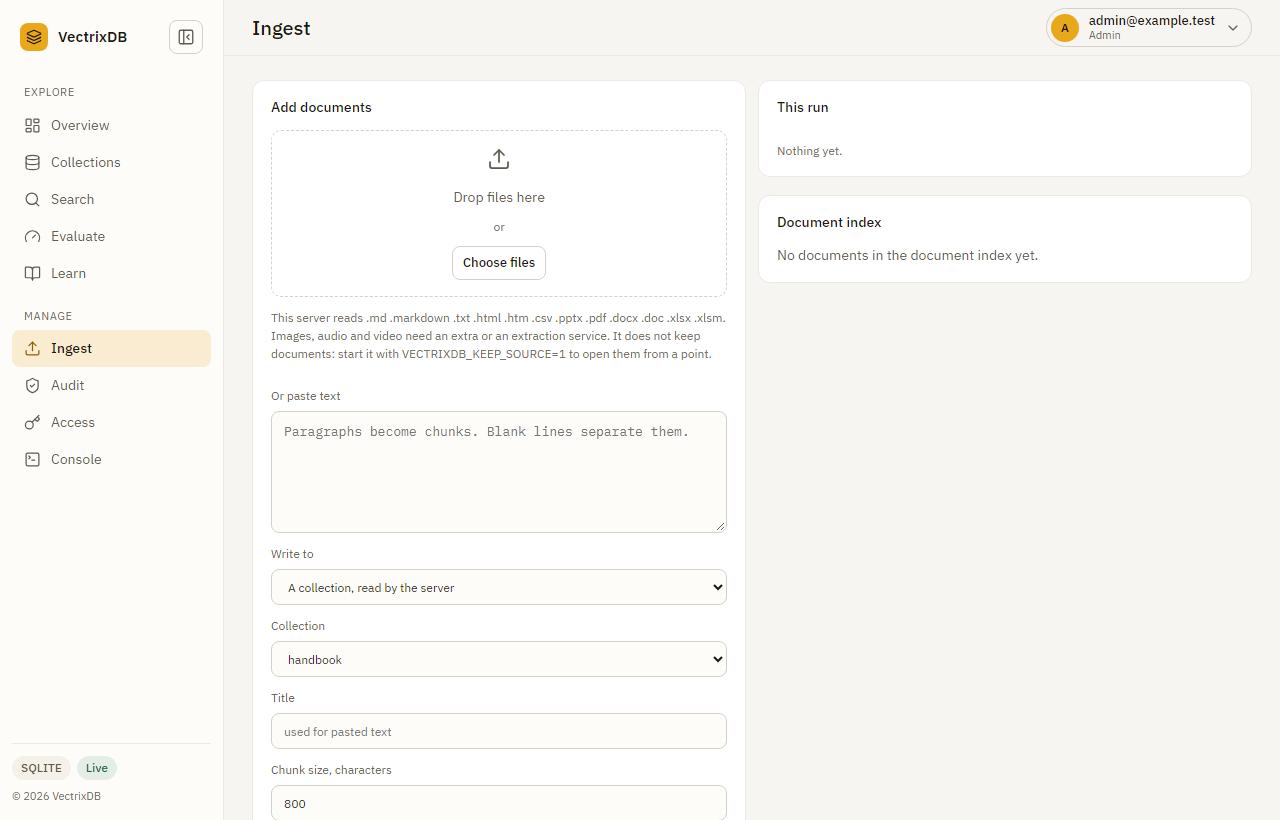
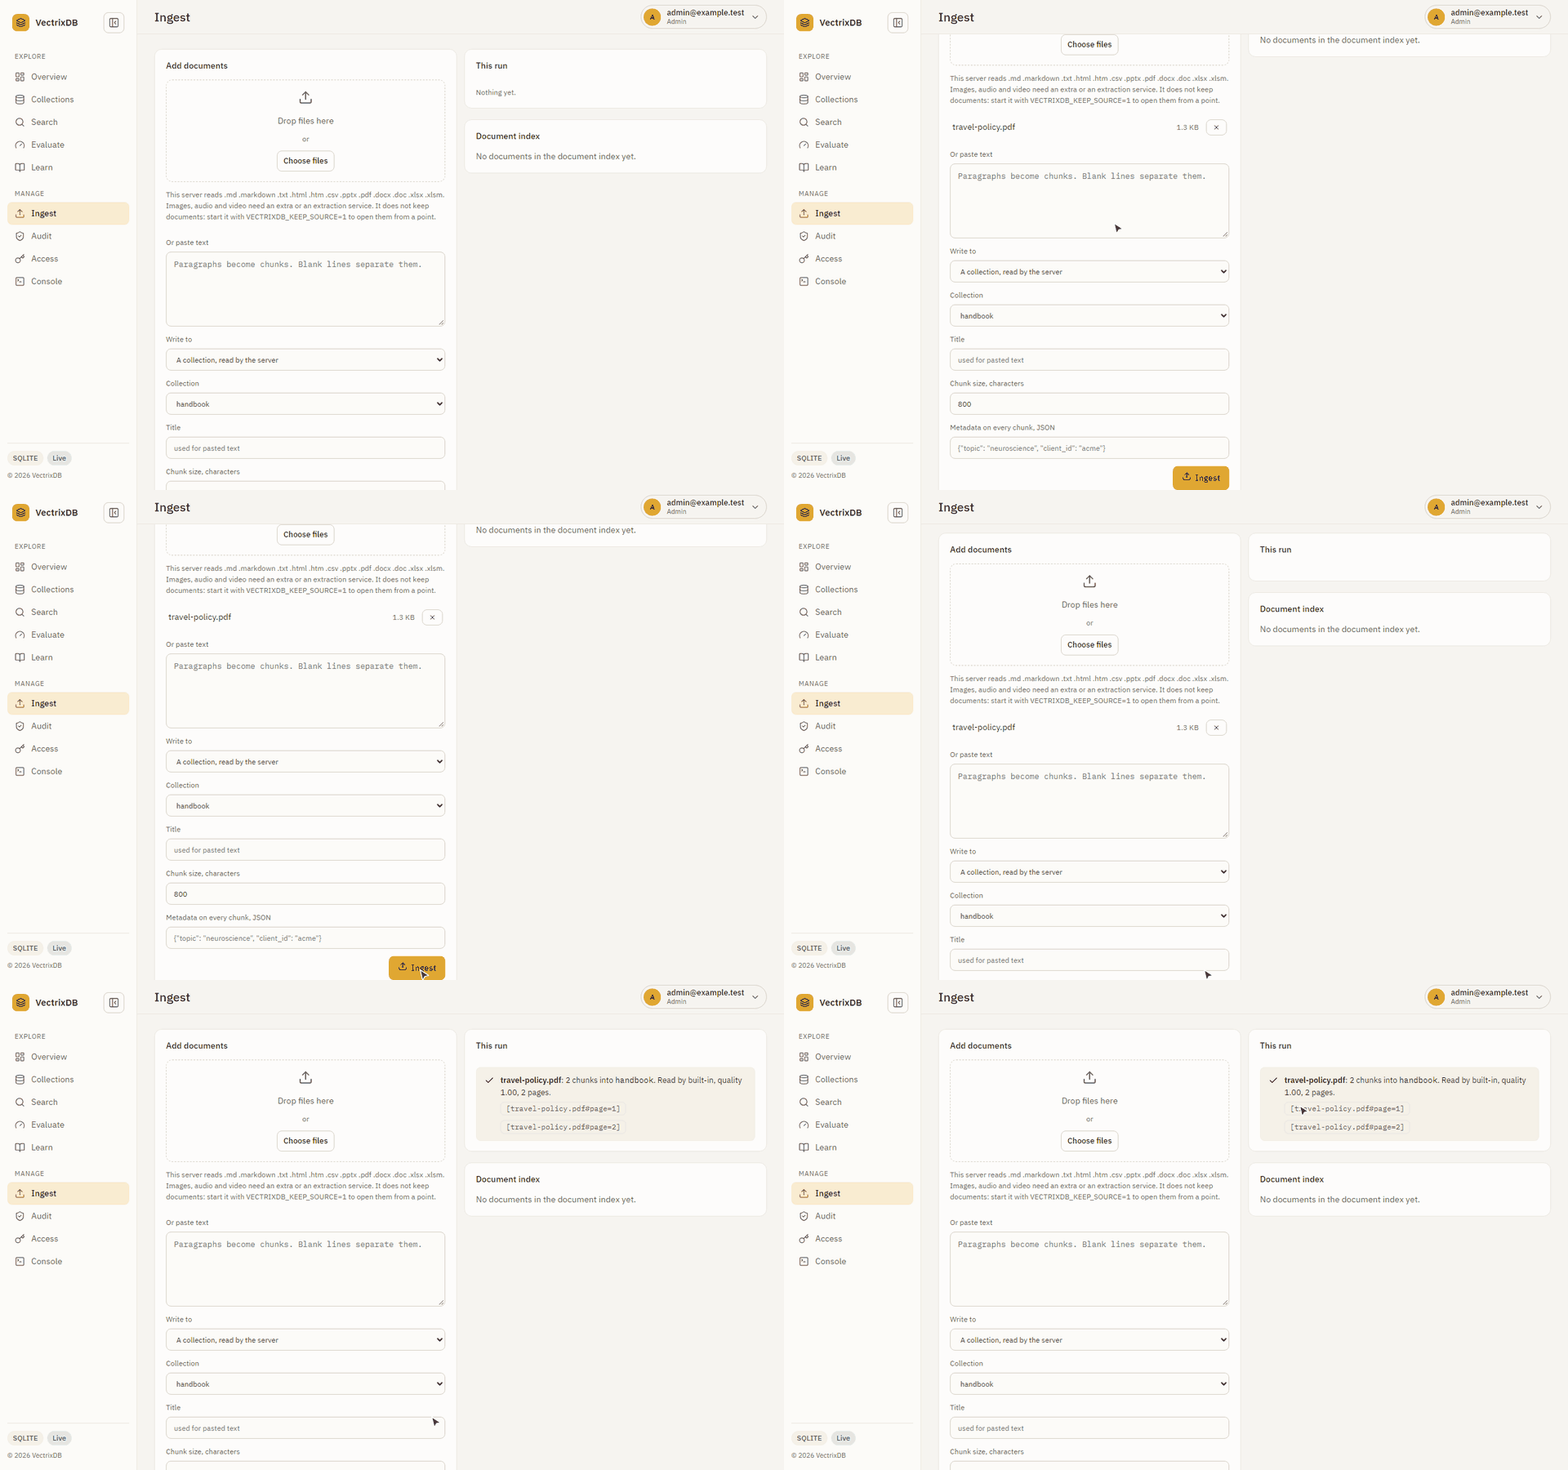
Send files to the server, which reads them the way add_document() does, or
paste paragraphs. It says which file types this server reads and who reads
each, and every document comes back with its chunk count, quality and
citations. Send two files or more and Quality of this run draws a bar for
each against the quality line, the ones under it in their own colour, so the
one scan that read badly stands out from the batch it came in with.
Audit
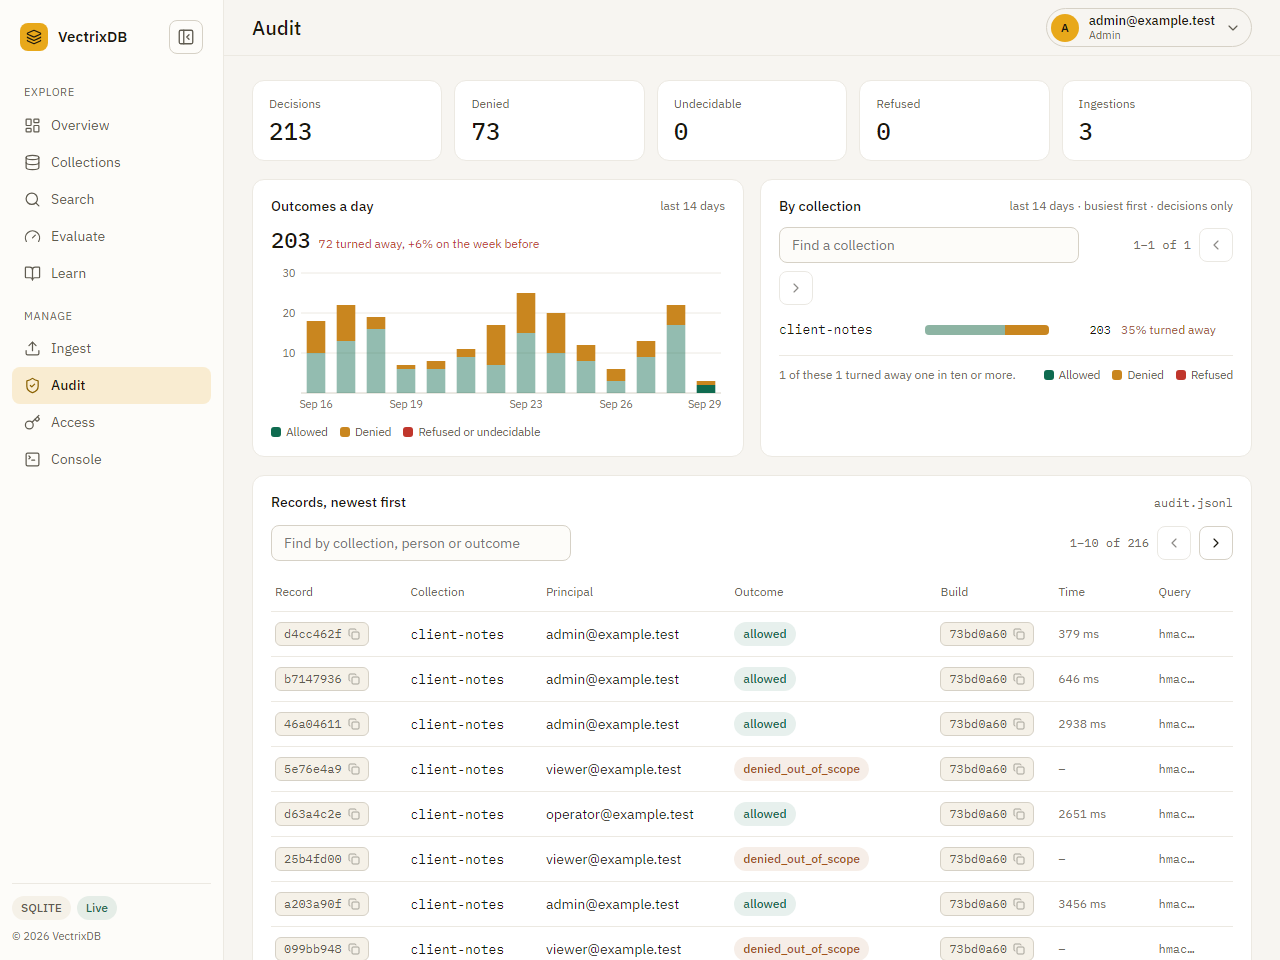
The audit trail a policied collection writes, for an admin, when the server is
pointed at it with VECTRIXDB_AUDIT_JSONL. Five totals over the whole trail,
then the last fourteen days twice: outcomes a day, allowed, denied, and
refused or undecidable stacked, which is where a day of denials stands out;
and by collection, the busiest first, with each one's denied and refused
counts in words beside the bar, because a thin slice of a long bar is easy to
miss. Every record in those days is counted, not only the newest ones listed
underneath. A collection with no policy makes no decisions, so it is not
there. Then the records, newest first: query text is never stored, only its
keyed fingerprint.
Access
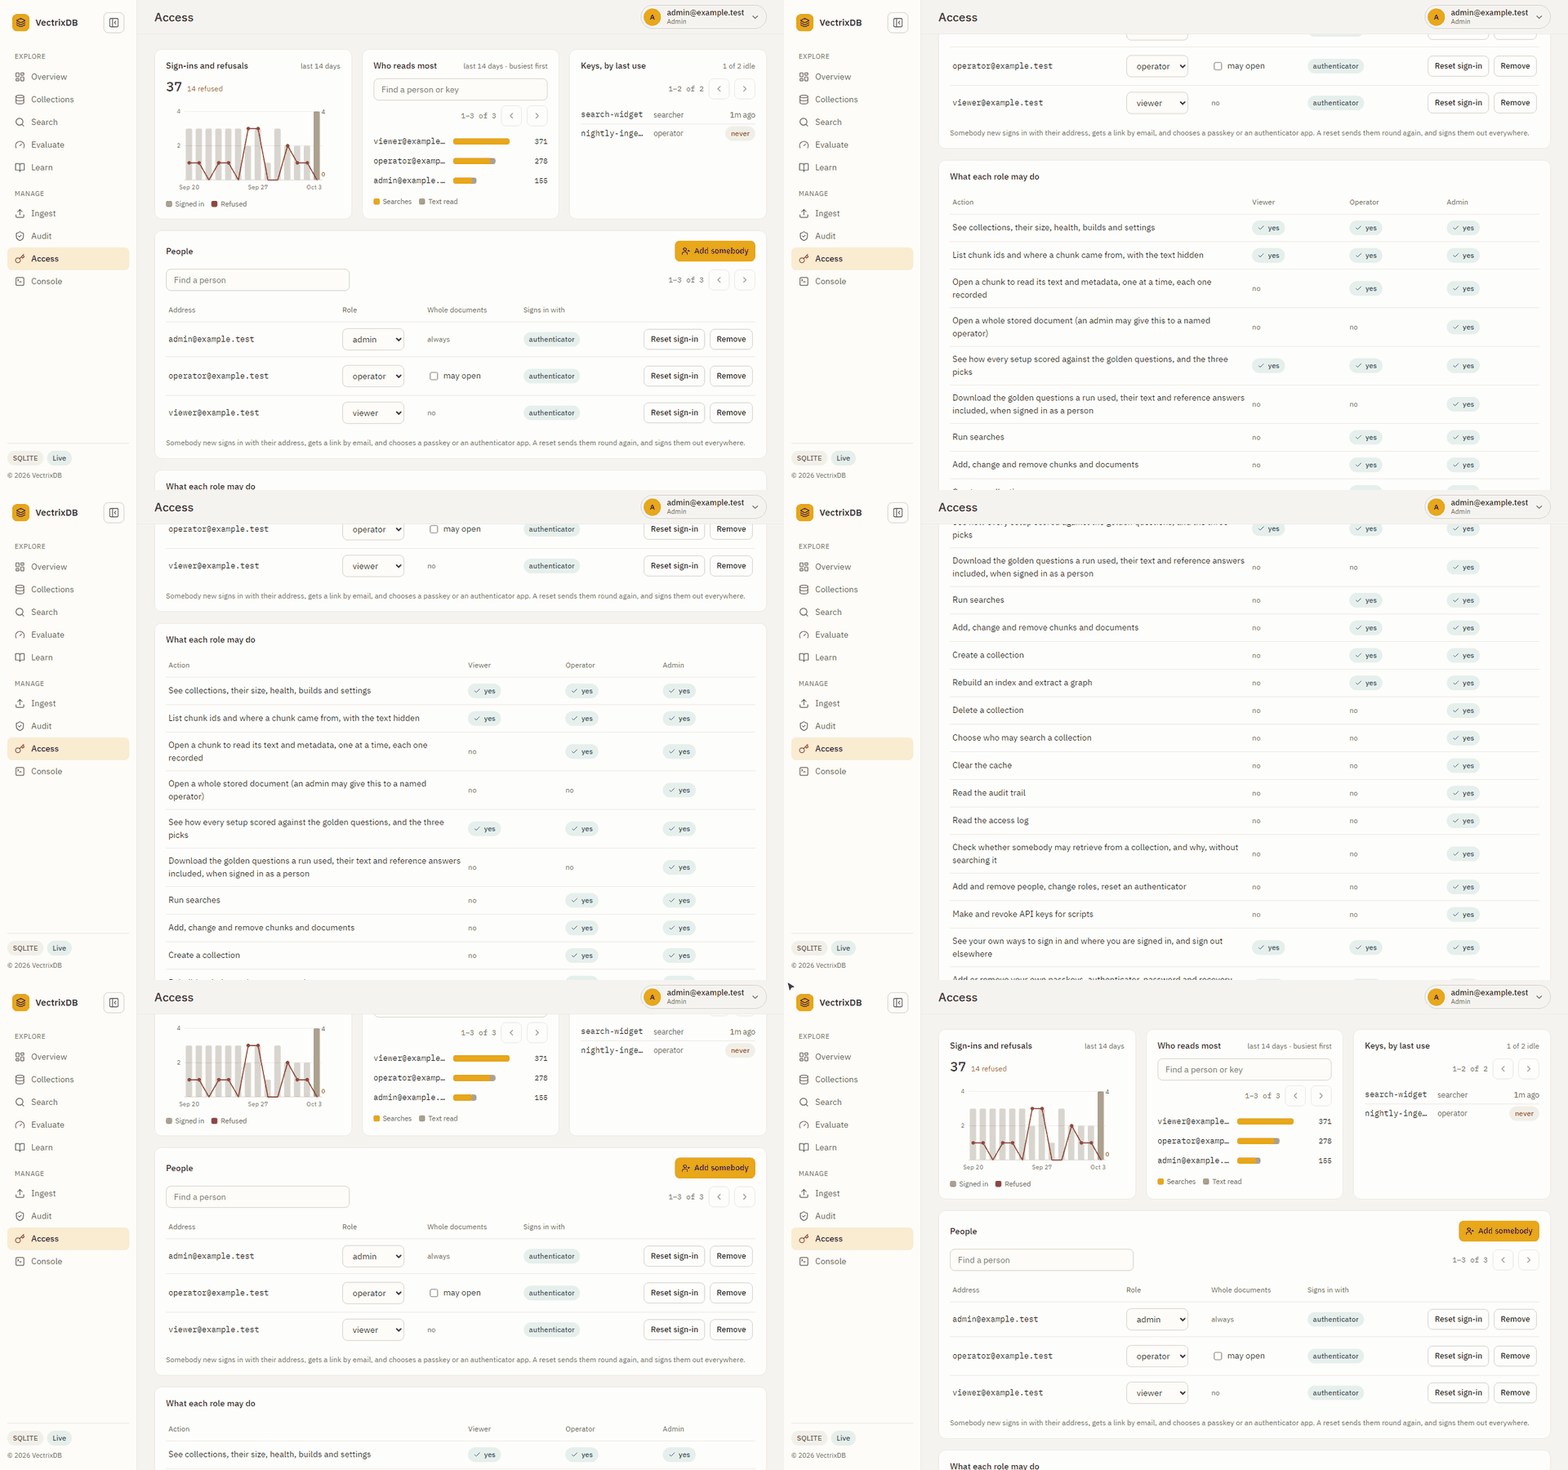
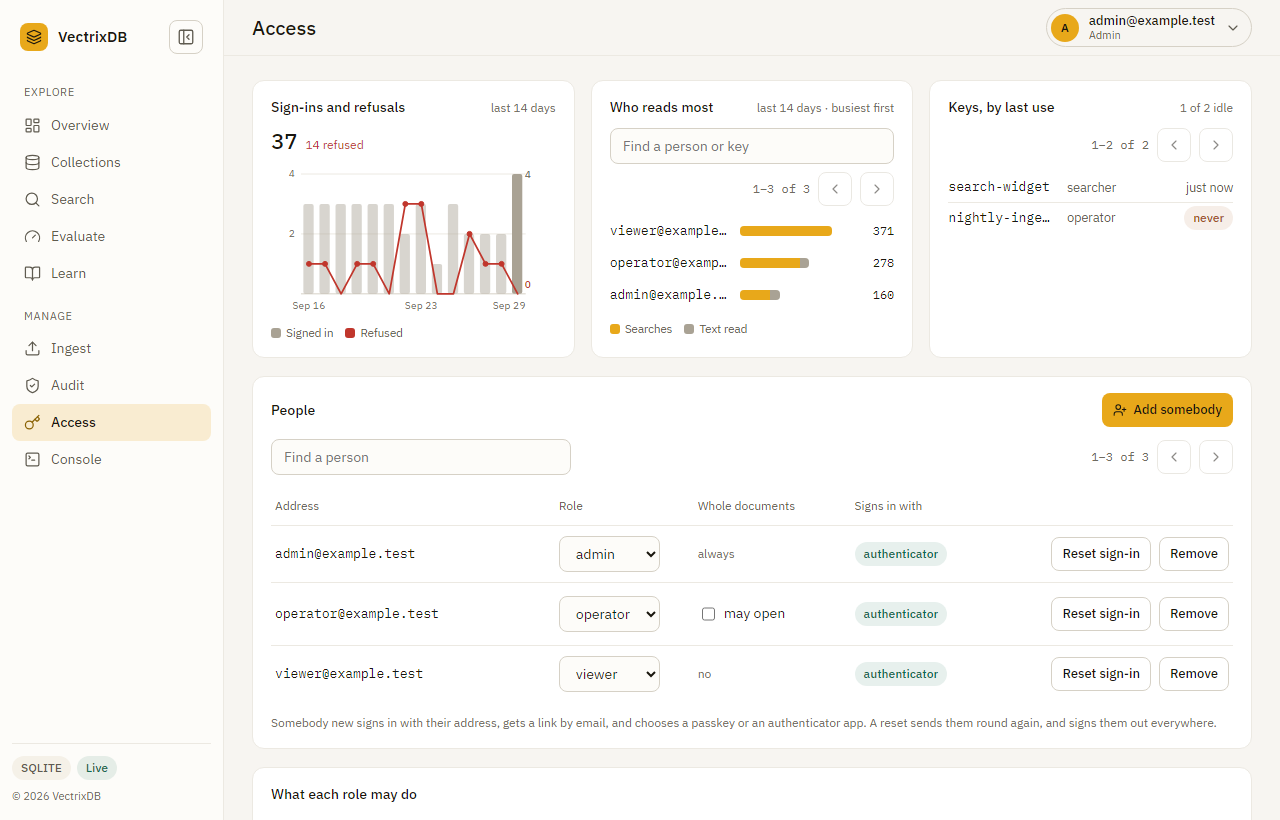
For admins: the people on the list and their roles, with single sign-on the groups that decide them, what each role may do, and the access log, newest first. Above them, sign-ins against refusals for the last fourteen days, where a refusal is a failed sign-in or a request a role did not allow; who reads most, the busiest people and keys of the last fourteen days with searches and text read apart, ten a page; and keys, by last use, ten a page, where a key not used for thirty days is marked: a key nobody uses is a key to revoke. The first is left out when the log goes to the server's output; the second is there for whoever may manage keys. Changing a role, like changing who may search a collection or deleting one, asks for a check from the last ten minutes.
Signing in
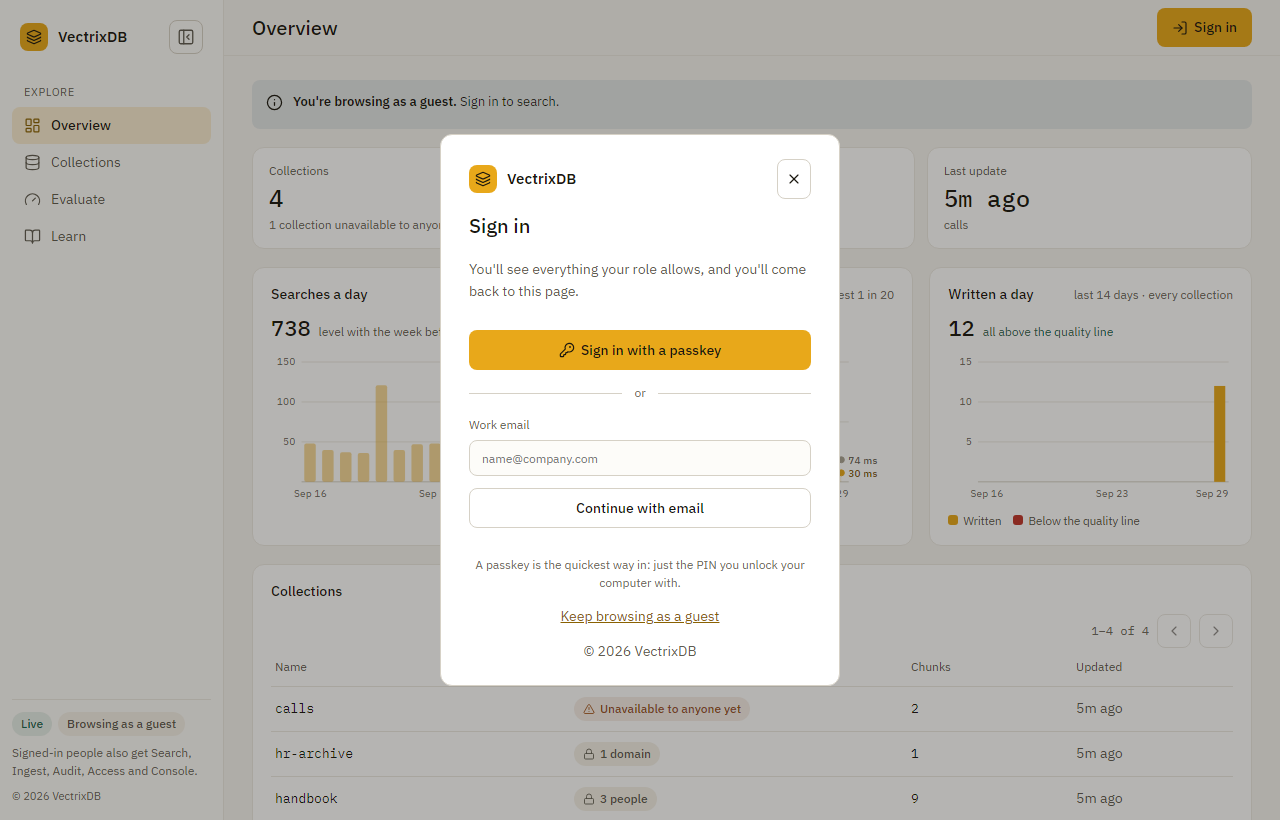
With sign-in on, the page opens on this card, or, with guests on, on the Overview with a Sign in button. It offers what the server has turned on: single sign-on, a passkey, a work email with an authenticator code, and a password with the code where passwords are on.
On a phone
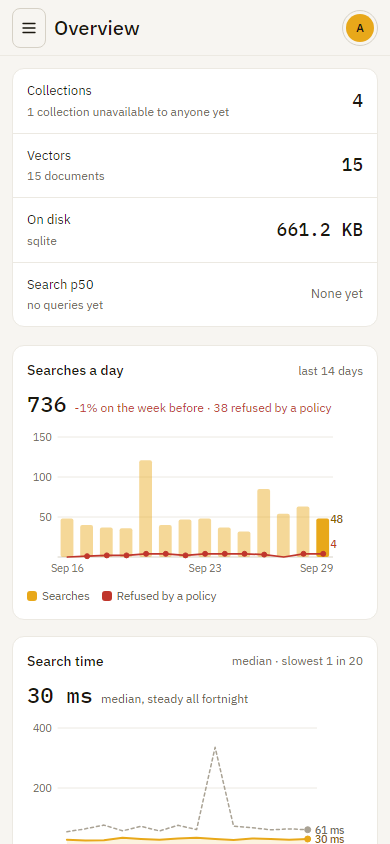
Every page works at phone width: tables become stacked rows, the sidebar becomes a drawer, and every control is big enough to tap.
The account menu
Your name at the top right opens the theme, light or dark, How you sign in for your own passkeys, authenticator, recovery codes and signed-in browsers, and for admins API keys for scripts, the Access page, and About: which VectrixDB this is, its version, the Apache licence and the NOTICE that travels with it.
Put your company's name, logo, colours and line on all of it: see Put your company's name on it.