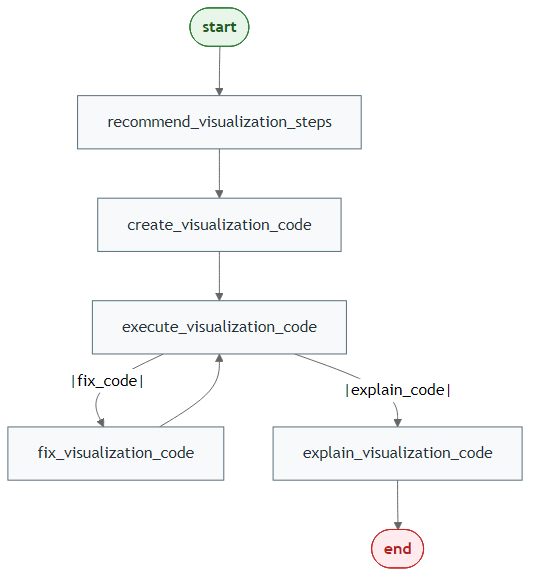
What This Agent Does
build_visualization_agent() generates visualization code
and explanations from data and user chart instructions.
Generate Mermaid PNGs
library(LLMAgentR)

my_llm_wrapper <- function(prompt, verbose = FALSE) "LLM response placeholder"

workflow <- build_visualization_agent(
  model = my_llm_wrapper,
  output = "both",
  direction = "LR"
)

save_mermaid_png(
  x = workflow,
  file = "pkgdown/assets/visualization-agent-workflow.png"
)
Step 1: Build the Agent
library(LLMAgentR)

my_llm_wrapper <- function(prompt, verbose = FALSE) "LLM response placeholder"

viz_agent <- build_visualization_agent(
  model = my_llm_wrapper,
  human_validation = FALSE,
  bypass_recommended_steps = FALSE,
  bypass_explain_code = FALSE,
  function_name = "data_visualization",
  verbose = FALSE
)